FTIR operating in the mid-infrared spectral range is a fast, user-friendly method of obtaining chemical composition information about a wide variety of samples. We are equipped with a high-resolution, multi-function research grade FTIR spectrometer, capable of examining a range of sample types (solids, liquids, pastes, powders) via different sampling accessories. For very small samples, information on the spatial variation of the composition can be obtained by the tandem infrared micro-spectrometer (the combination of the spectrometer and a microscope in a confocal setup).
Equipment
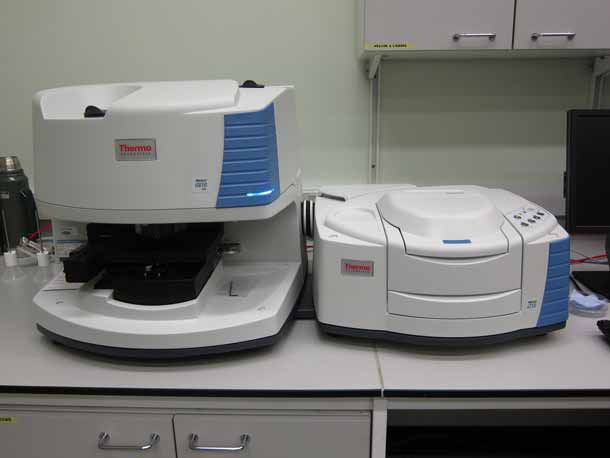
Nicolet iN10 MX FTIR tandem imaging system
- Conventional FTIR: ATR and DRIFT sampling
- Microscope: spatial resolution 10 micron in aperture mode (diffraction-limited)
- Point, Line and Area scans
- Transmission, reflection and ATR measurements
- Advanced data manipulation and image analysis
The microscope produces a hyperspectral data cube where each X,Y element is associated with a spectrum in the Z dimension, from which information about the chemical composition can be extracted. An image is then obtained by assigning each pixel a colour determined by the result of the spectral analysis. Because IR spectra contain large amounts of parallel information, different images can be plotted for individual components like protein, starch, or lipids. Unlike most conventional microscopy techniques, this process does not require any staining.
We can provide advice on sampling, measurement, and data analysis. We also carry out one-off sample analyses for external customers and work on industrial contracts. We welcome interaction with external organixations, particularly with a view to collaboration. Please contact us for more information.